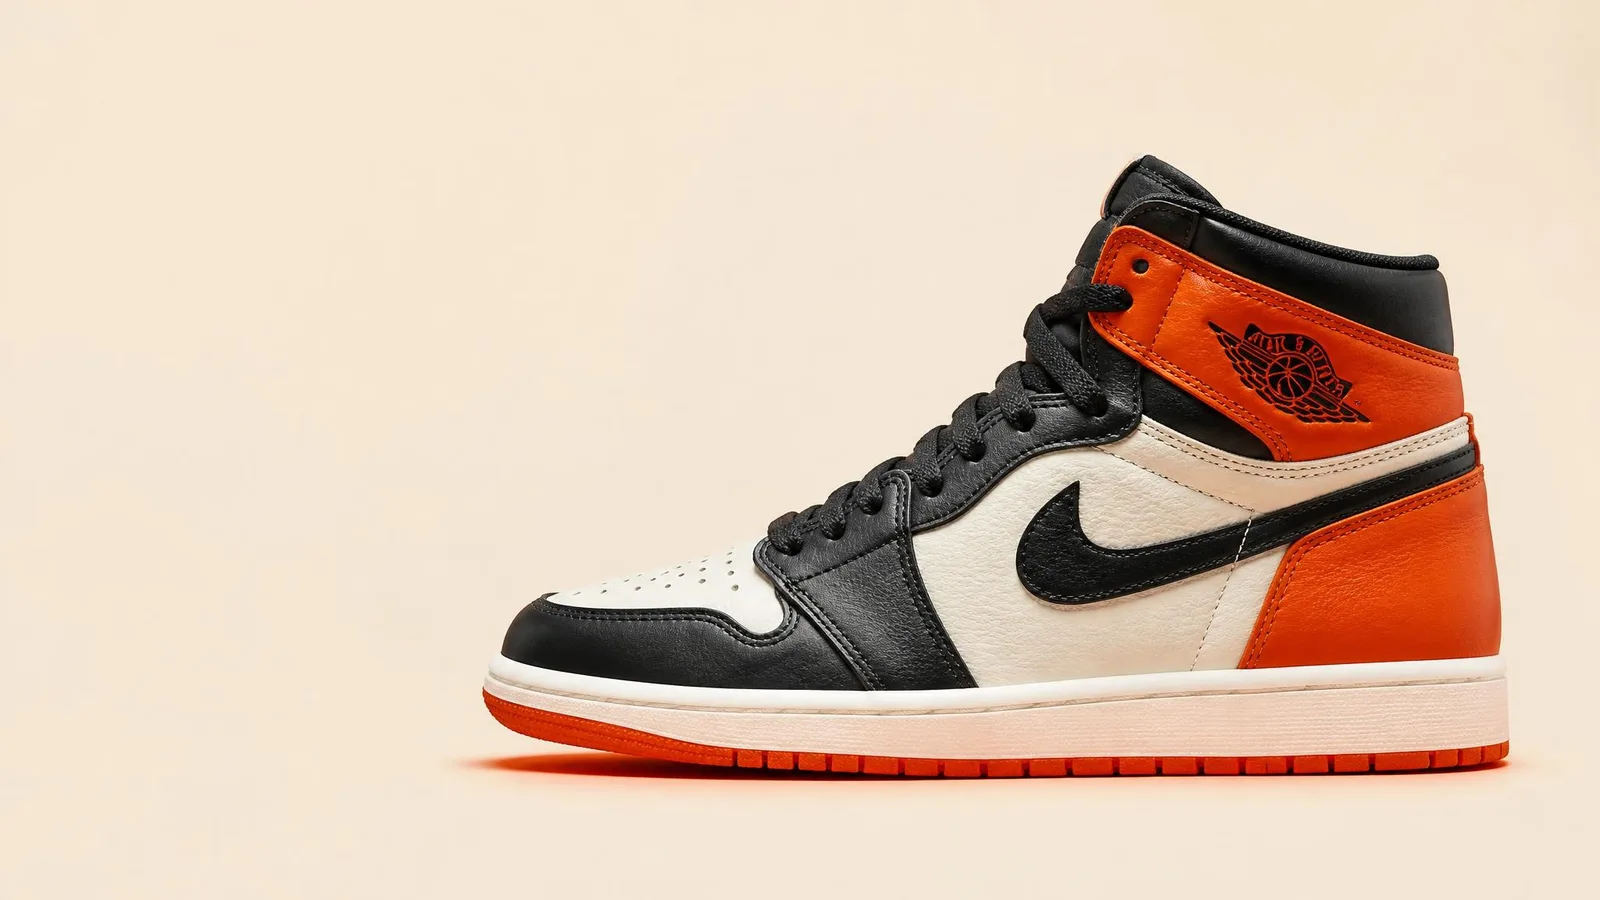
You open one sneaker app and your Air Jordan 1 is valued at $260. Another shows $225 for the same size and colorway. Is one of them wrong?
Usually not. Sneaker apps may be showing different timestamps, price types, size data, fees, or valuation methods. Here are the six most common reasons—and which number to use when buying, selling, or tracking your collection.
Reason 1: They Are Not Updating at the Same Time
Apps do not all refresh at the same moment. Some pull new data every few minutes. Others update once a day. Some only recalculate when you open them.
Two apps checked at the same moment can be showing prices from completely different points in time. If one app updated at 9am and another at 2pm, and a colourway moved between those windows, the values will differ. Neither is wrong. They are snapshots taken at different hours.
On a thinly traded sneaker, even one new sale can move the size-specific reference price. If one app has processed that sale and another has not, their displayed values will temporarily diverge. Check each app's "last updated" time before comparing figures.
For most collectors, daily updates ("updated daily," as CYKI describes its own refresh cycle) are entirely sufficient. Real-time data reduces update lag, but it does not eliminate differences in methodology, size treatment, fees, or market coverage. Two apps can both be real-time and still disagree for the other 5 reasons in this article.
Reason 2: They Are Showing Different Types of Price
Three figures are commonly confused: the last sale, the highest bid, and the lowest ask.
The last sale records the price of a previous transaction. The highest bid is what a buyer currently offers, while the lowest ask is the minimum price a seller currently requests.
The difference between the highest bid and lowest ask is called the bid/ask spread. The difference between a last sale and a current ask is not technically a spread. It simply shows that the market has changed—or that sellers' expectations differ from the most recent transaction.
For example, a pair might have last sold for $220 while the highest current bid is $210 and the lowest ask is $280. The $220 figure describes a previous sale. The $210 bid indicates what you may be able to sell for immediately, before fees. The $280 ask indicates what it may cost to buy the pair immediately, before any additional checkout costs.
So which sneaker price should you use? If you want to estimate quick-sale proceeds, start with the highest bid and subtract selling costs. If you want to know what it would cost to buy the pair now, use the lowest ask and add any buyer fees, shipping, taxes, or duties. If you are tracking market value over time, use recent size-specific sales.
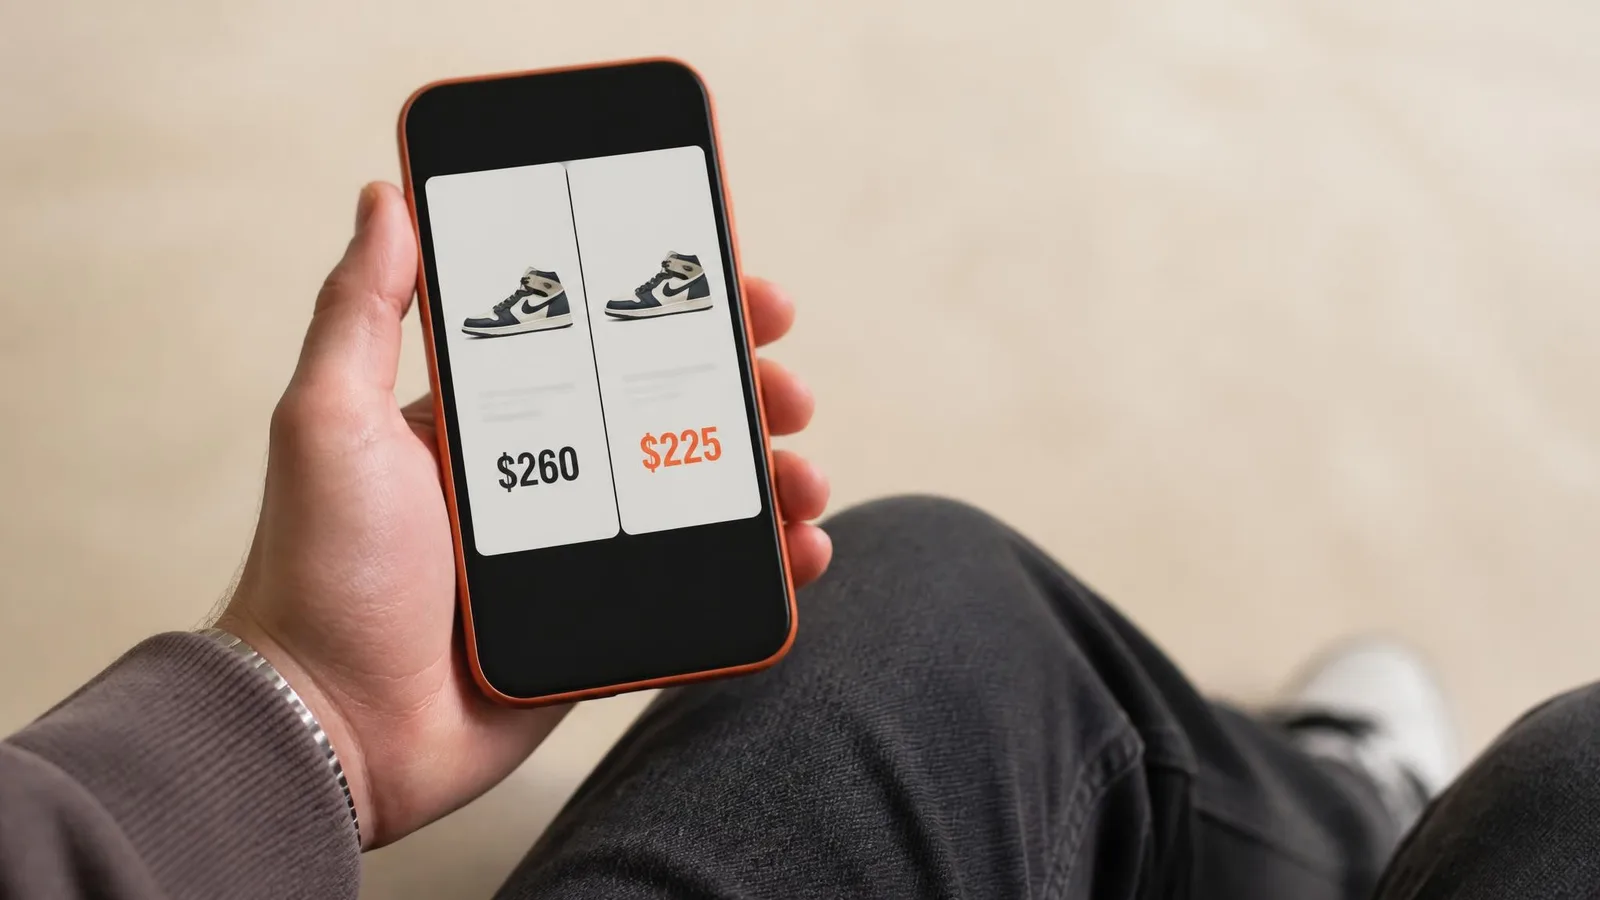
Reason 3: Apps Use Different Valuation Methods
One app may display the most recent sale, while another may calculate an average from several recent sales. A third may combine sales from multiple marketplaces or apply a fallback when recent data is unavailable.
Each method can produce a different value for the same pair.
Consider a sneaker that increased in price after a celebrity was photographed wearing it. An app based on the most recent sale may reflect that increase immediately. An app using a longer average will move more slowly because its calculation still includes earlier, lower-priced sales.
Neither approach is automatically better. A recent-sale method responds quickly but can be distorted by one unusual transaction. An average is more stable but may take longer to reflect a genuine market shift.
When evaluating a sneaker app, look for five things: which marketplaces supply its data, how recent the sales are, whether prices are size-specific, how often values update, and what happens when recent sales are unavailable.
CYKI explains its data sources and fallback rules on its methodology page, allowing collectors to see how a reference value was calculated.
Reason 4: They Treat Sizes Differently
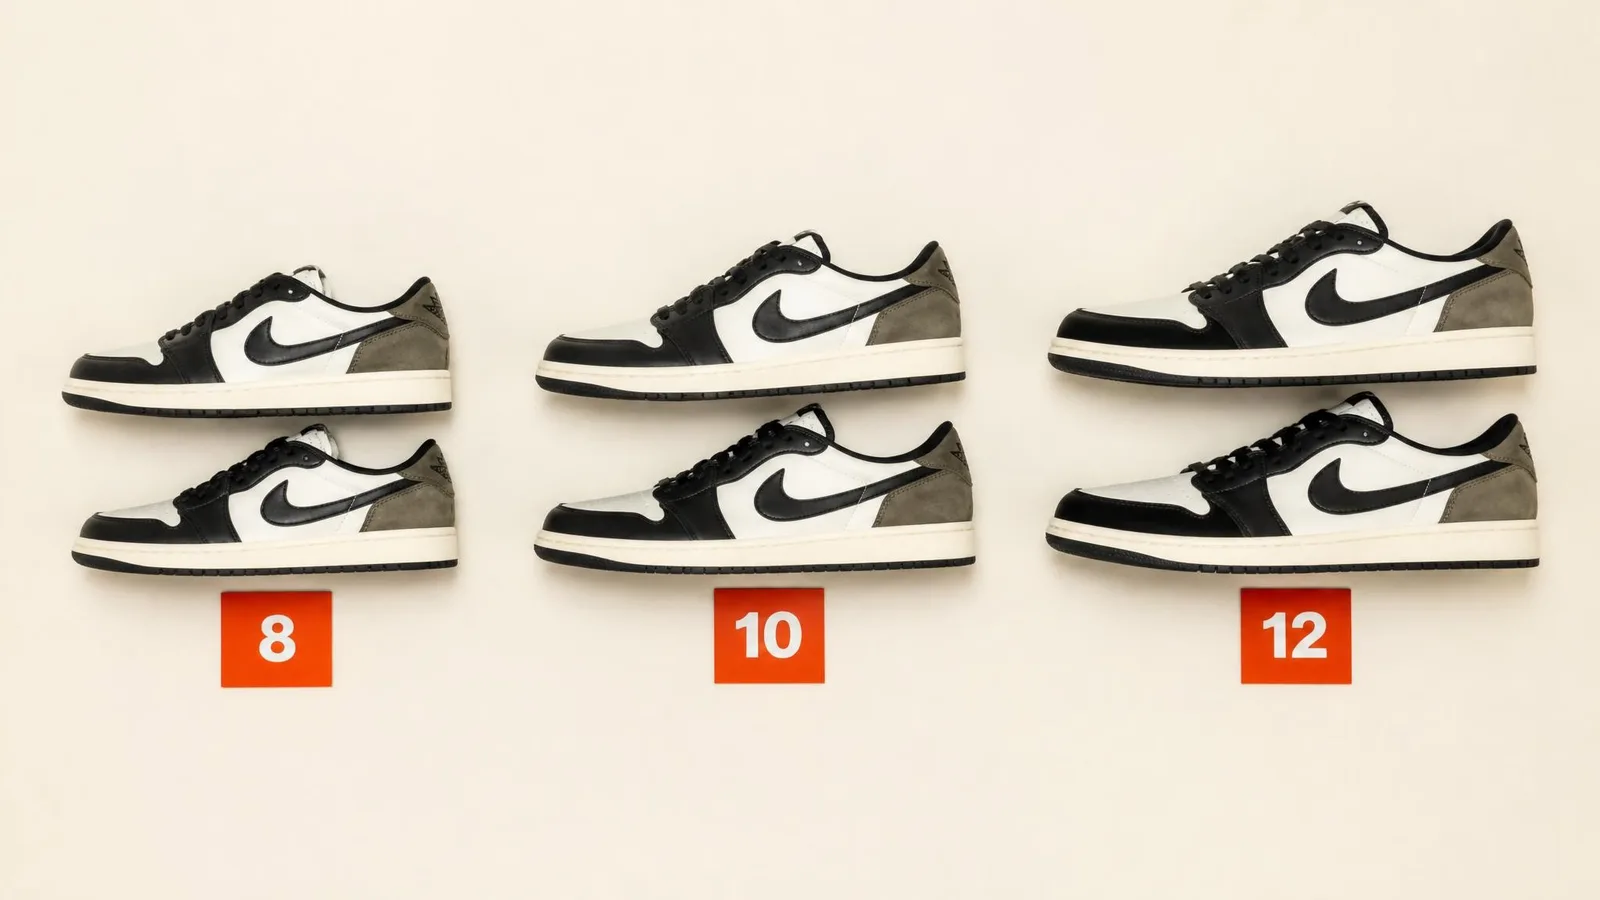
Sneaker prices are size-specific because supply and demand vary by size. A scarce size may command a premium, but it may also have fewer potential buyers and take longer to sell. There is no universal rule that common sizes are cheaper or that extreme sizes are always more valuable.
Some apps display the most recent or average price for your exact size. Others show one value calculated across every available size. These figures can differ because an all-size average blends common sizes with more expensive or less liquid outliers.
For example, the average value across sizes 7 to 14 may be $250 even though the most recent sales for a size 10 were closer to $220. In that case, $250 is a broad reference value, not the price a size 10 owner should expect to receive.
When comparing apps, confirm that both are showing the same SKU, size, sizing category, and condition. A men's size, women's size, grade-school size, or used pair may have a different market value even when the model and colorway appear identical.
Reason 5: They Show Different Stages of the Transaction
An app may display the seller's ask, the recorded sale price, the buyer's checkout total, or the seller's net payout. These figures are not interchangeable.
The buyer's checkout total can include processing fees, shipping, taxes, and import duties. The seller's net payout can be reduced by commission, payment-processing charges, shipping costs, and cash-out fees. Location can also affect which costs are included in the displayed price.
StockX, for example, explains that its displayed Ask can include duties and taxes depending on the buyer's location. It also notes that its sales history does not always use the same regional pricing calculation. You can read its explanation of StockX pricing models here.
GOAT deducts commission and seller fees from the listing price and may also charge a cash-out fee. Its current charges are explained in the GOAT fee policy.
For collection tracking, decide which type of value you want to measure. Gross market value estimates the pair's market price before deductions. Replacement cost estimates what you would pay to buy it today. Net resale value estimates what you could actually receive after selling costs. Comparing one of these figures with another will create an apparent price discrepancy even when both calculations are accurate.
Reason 6: There May Not Be Enough Recent Sales Data
When a sneaker has few recent sales, its latest recorded transaction may no longer represent the current market. This is common with older releases, uncommon collaborations, rare sizes, and pairs that change hands infrequently.
In that situation, an app may display an older sale, use current listing data, apply a documented fallback method, or decline to provide a value. Because platforms make different choices, thinly traded sneakers often show the largest price differences between apps.
These values should be treated as lower-confidence estimates, not exact sale prices. Check when the last transaction occurred, whether it involved your size, and whether the displayed figure comes from an actual sale or an estimated fallback.
This is especially important for grails and limited collaborations. A high displayed value does not necessarily mean a buyer is currently willing to pay that amount. If you are curious about how different collection apps handle valuation, that comparison provides additional context.
So Which Sneaker Price Should You Trust?
The short answer: neither number needs to be discarded. The useful question is not which number is correct. It is what each number is measuring.
A last-sale price tells you what someone actually paid. An ask price tells you what sellers currently want. A 90-day average tells you where the market has been. Each has a use case, and knowing how to know which sneaker price to trust starts with understanding which question you are asking.
For tracking your collection over time, consistency matters more than choosing a supposedly perfect number. Using the same source and methodology creates a meaningful trend line. Switching between apps that use different calculations can create apparent gains or losses that are really just measurement differences.
Whatever source you choose, confirm that the value matches your exact SKU, size, condition, currency, and region.
CYKI uses resale marketplace data based on recent actual sales, updated daily, with data gaps identified openly. You can see exactly how CYKI sources its values and understand what the number is based on, not just what the number is.
Frequently Asked Questions
Why does StockX show a different price than GOAT for the same shoe?
First confirm that both platforms are showing the same SKU, size, condition, region, and type of price. StockX and GOAT may display different asks, sales histories, fees, taxes, duties, and seller deductions. The price shown on a product page is not always the amount a buyer pays or a seller receives.
Can two apps show different prices and both be correct?
Yes. One app may show a recent sale while another shows the current lowest ask or an estimated value. Both figures can be accurate, but they answer different questions.
What does "last sale" mean on a resale app?
The last-sale figure is the price recorded for the most recent transaction, as defined by that platform. It is a historical figure and may not equal the current highest bid, lowest ask, buyer checkout total, or seller payout.
Why does my sneaker collection value change between apps?
Apps may use different update times, data sources, size treatments, transaction types, fees, and fallback methods. Your collection may not have changed—the apps may simply be measuring it differently.
The Price Difference Is the Data Talking
There is no universal sneaker price. Every value is tied to a source, size, condition, timestamp, region, and stage of the transaction.
Before comparing two figures, make sure they are measuring the same thing. A current ask should be compared with another current ask. A size-specific sale should be compared with sales for the same size. A seller payout should not be compared with a buyer's checkout total.
For collection tracking, the most useful valuation is not necessarily the highest or lowest number. It is the one calculated consistently enough to show how your collection changes over time.
Some pairs are personal. Some are valuable. Most are both. Track your rack on CYKI using daily updates, documented data sources, and clearly identified fallback values.