CYKI Press Kit
CYKI is a sneaker portfolio tracker — collectors see what their collection is actually worth, live, and whether they're beating the market.
Fact sheet
What the data says
Five findings from the CYKI 100, an independent index of the resale market — figures as of 27 August 2026. Journalists can request current figures any time at privacy@canyoukicksit.com.
The crash isn't showing up in the data — but the market isn't calm either.
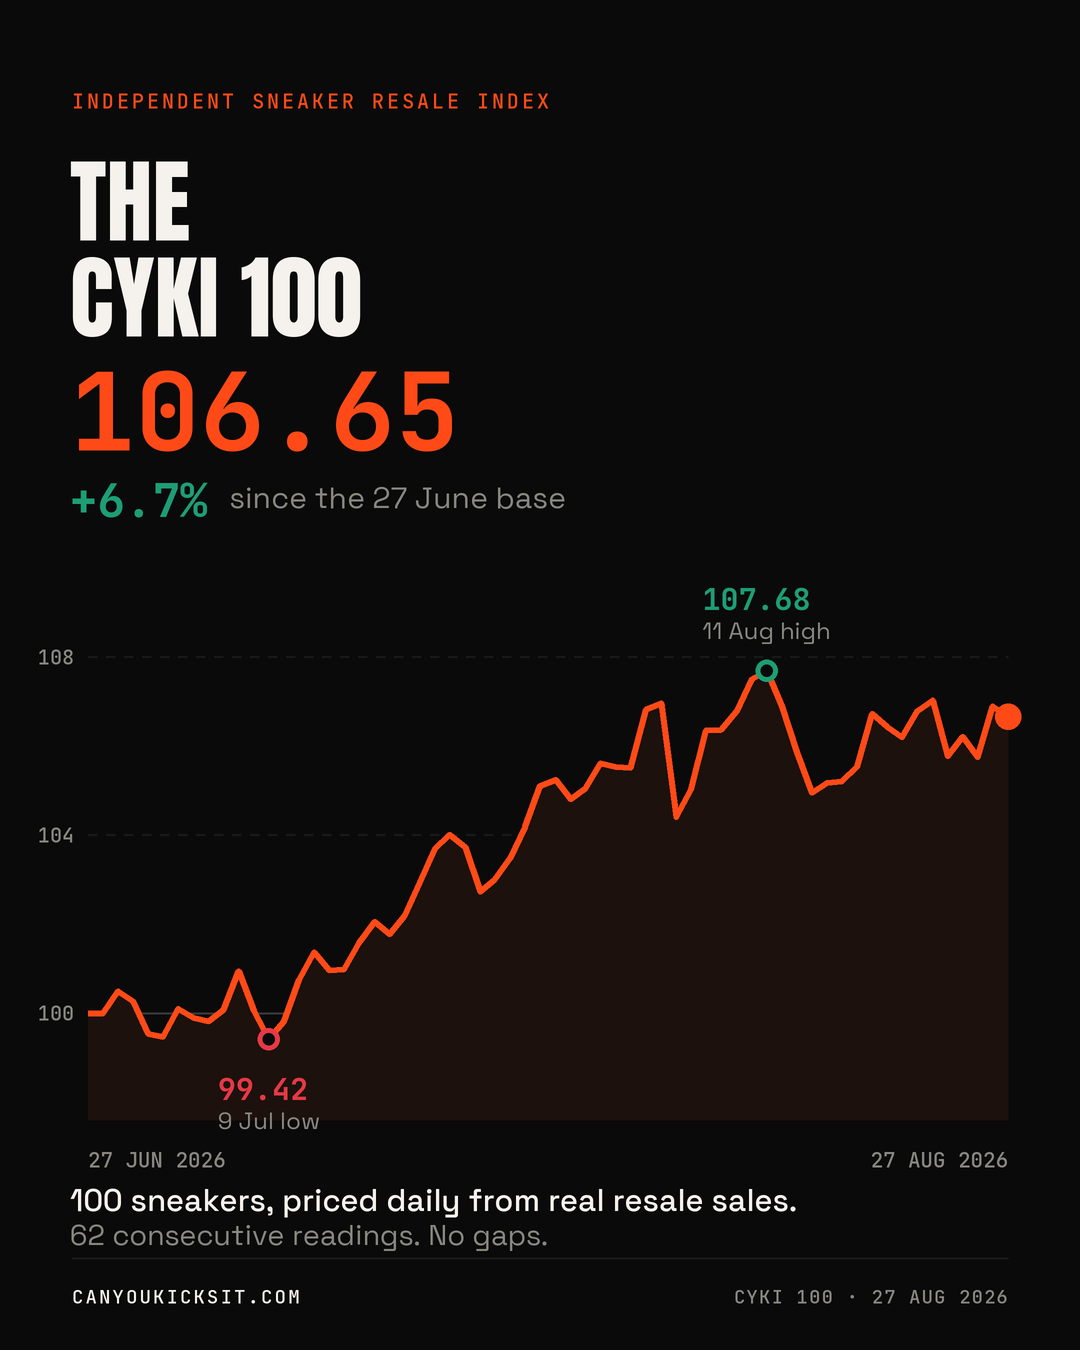
Since inception (27 June to 27 August 2026) the CYKI 100 is up +6.7% (level 106.65), across 62 consecutive daily readings with no gaps. Inside that run it fell to 99.42 on 9 July and peaked at 107.68 on 11 August — it sits 1.0% below that high today. Whatever the "resale is dead" headlines say, the index's 100 sneakers are up over eight weeks, with real swings inside the trend.
It's a market of sneakers, not a sneaker market.
In the week of 20 to 27 August: 41 of the 100 constituents rose, 50 fell, 9 were flat — and the index itself moved just +0.4%. Averages hide everything. Since inception the split is 54 up, 46 down, none unchanged.
A 73-point spread in one week.
Best performer, week of 20 to 27 August: Nike Dunk Low Redwood, +54.4% ($79 to $122). Worst: Nike Dunk Low Medium Curry, −18.4% ($125 to $102). Same market, same week, 72.8 points apart.
July's biggest winner is now down 42%.
We published these figures on 17 July, and we don't quietly revise them. July's best weekly performer, the Converse Chuck Taylor All Star 70 Ox Comme des Garçons PLAY Black, has since fallen from $297 to $169 — −43.1%. July's worst, the Nike Dunk Low Stranger Things Phantom, is up from $210 to $234 — +11.4%. A one-week spike is not a trend, which is the whole argument for a continuous index over a viral screenshot.
Yeezy has gone precisely nowhere. ASICS is up 16%.
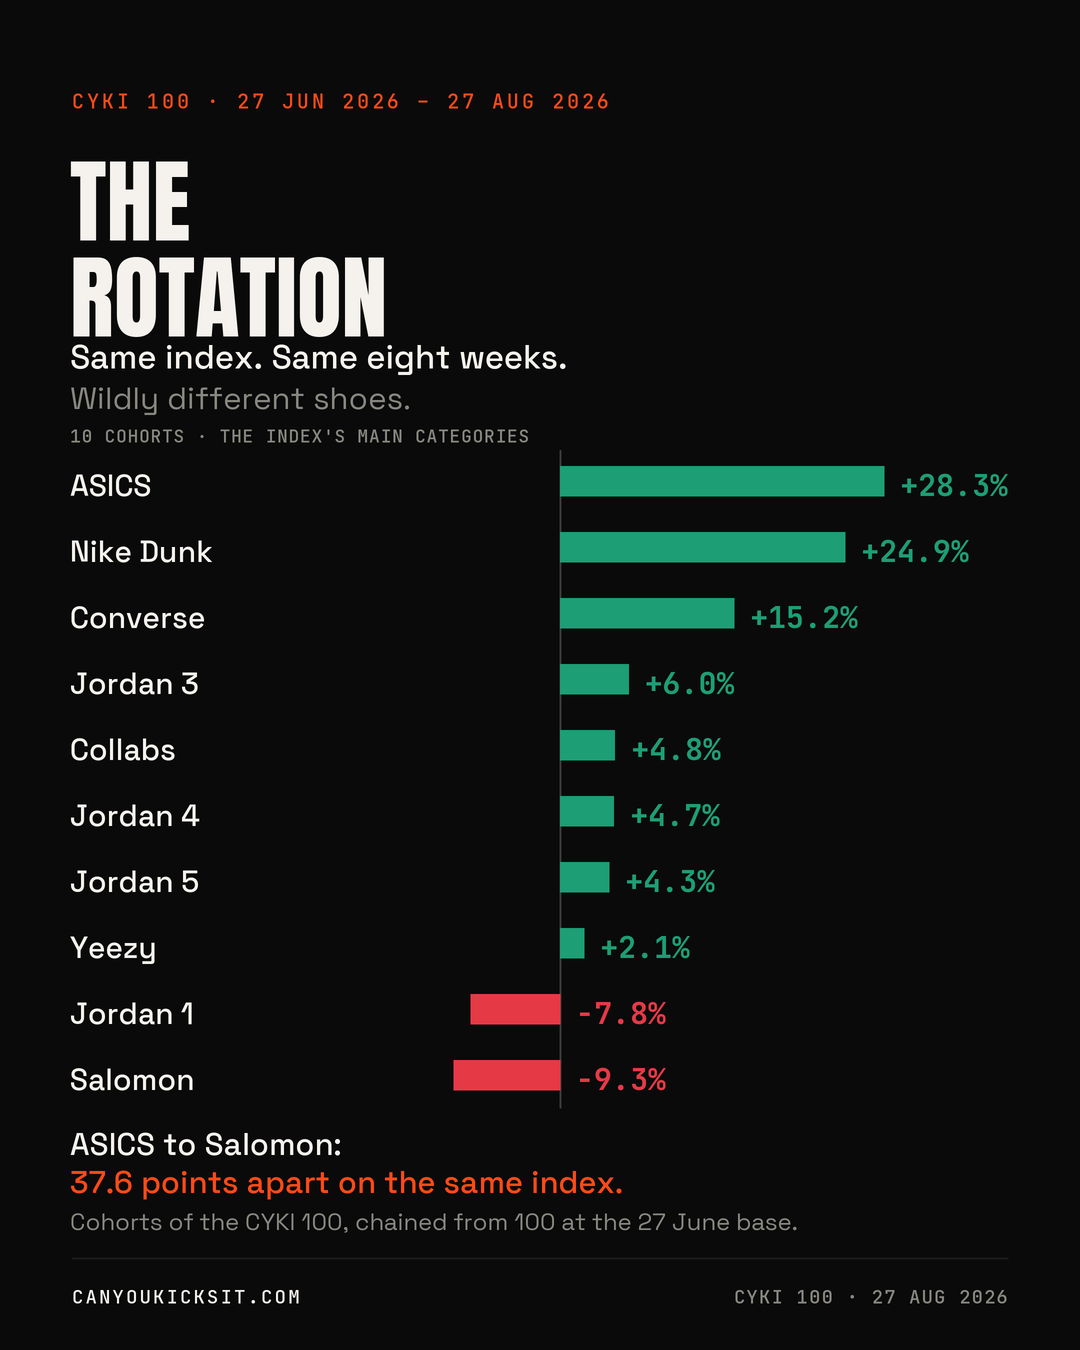
Cut the same index into cohorts and the headline number stops being the story. Each cohort below is chained from 100 at the 27 June base, using the identical method as the CYKI 100 itself.
| Cohort | Level | Since 27 Jun |
|---|---|---|
| ASICS | 128.30 | +28.3% |
| Nike Dunk | 124.88 | +24.9% |
| Converse | 115.24 | +15.2% |
| Jordan 3 | 106.00 | +6.0% |
| Collabs | 104.80 | +4.8% |
| Jordan 4 | 104.67 | +4.7% |
| Jordan 5 | 104.26 | +4.3% |
| Yeezy | 102.09 | +2.1% |
| Jordan 1 | 92.19 | −7.8% |
| Salomon | 90.73 | −9.3% |
The index's largest cohort is Yeezy: eight weeks, a net move of +2.1%. Meanwhile the technical-runner trade split in two — ASICS up 28.3%, Salomon down 9.3% — so “gorpcore” is not one position. The ten cohorts above cover the index's main categories. A category with too few shoes to behave like a group is left out rather than shown as a cohort of its own.
Story angles
- The independent-index angle. The CYKI 100 is an independent daily index — not run by a marketplace, unlike the platforms whose own listings and sales set resale prices in the first place.
- The market-correction angle. Independent, methodology-published data on the "is resale dead" debate — an actual index to cite instead of anecdote. Eight weeks in, the answer is "up 6.7%, and noisier than either side claims."
- The collector angle. StockX killed its Portfolio feature in March 2026 — collectors lost the one tool built to track what they hold. CYKI is the replacement nobody else built.
- The hype-cycle angle. The pair we named as July's biggest riser is down 42% five weeks later (Finding 04). Single-week moves are what get screenshotted; a daily index is what shows whether they held.
Assets for download
Free to use in editorial coverage of CYKI. Click a thumbnail to open the full-resolution file, then save it.
The 3D render is a marketing/hero asset — use it for editorial headers, story art, or anywhere large. It is also the mark we use as the site icon. It is not the app-store icon: the rounded mask and glow are baked into the file, so for a masked or app-store-style placement, use the flat icon mark instead.



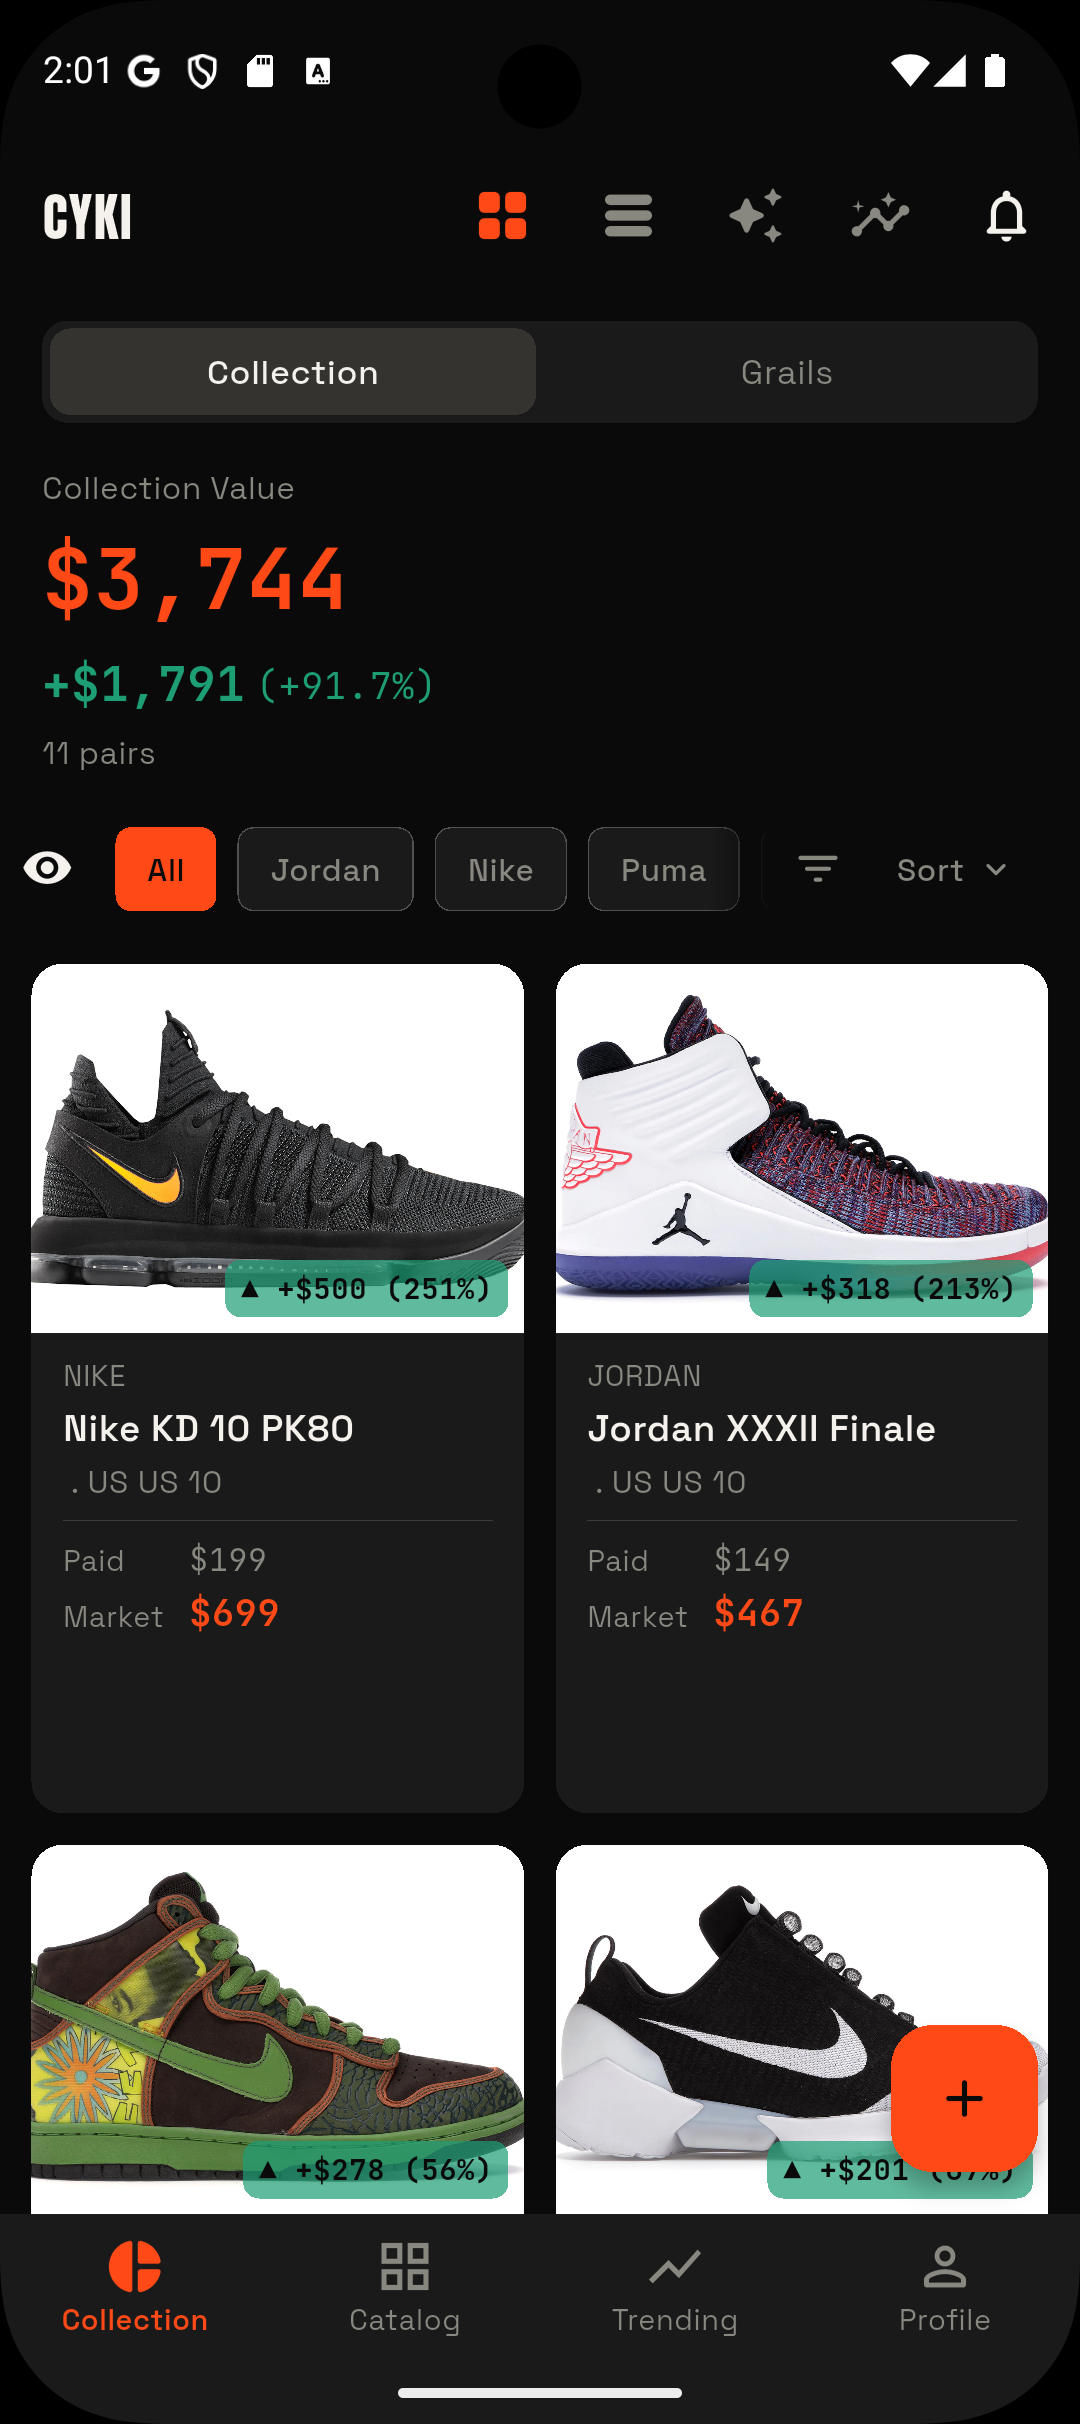
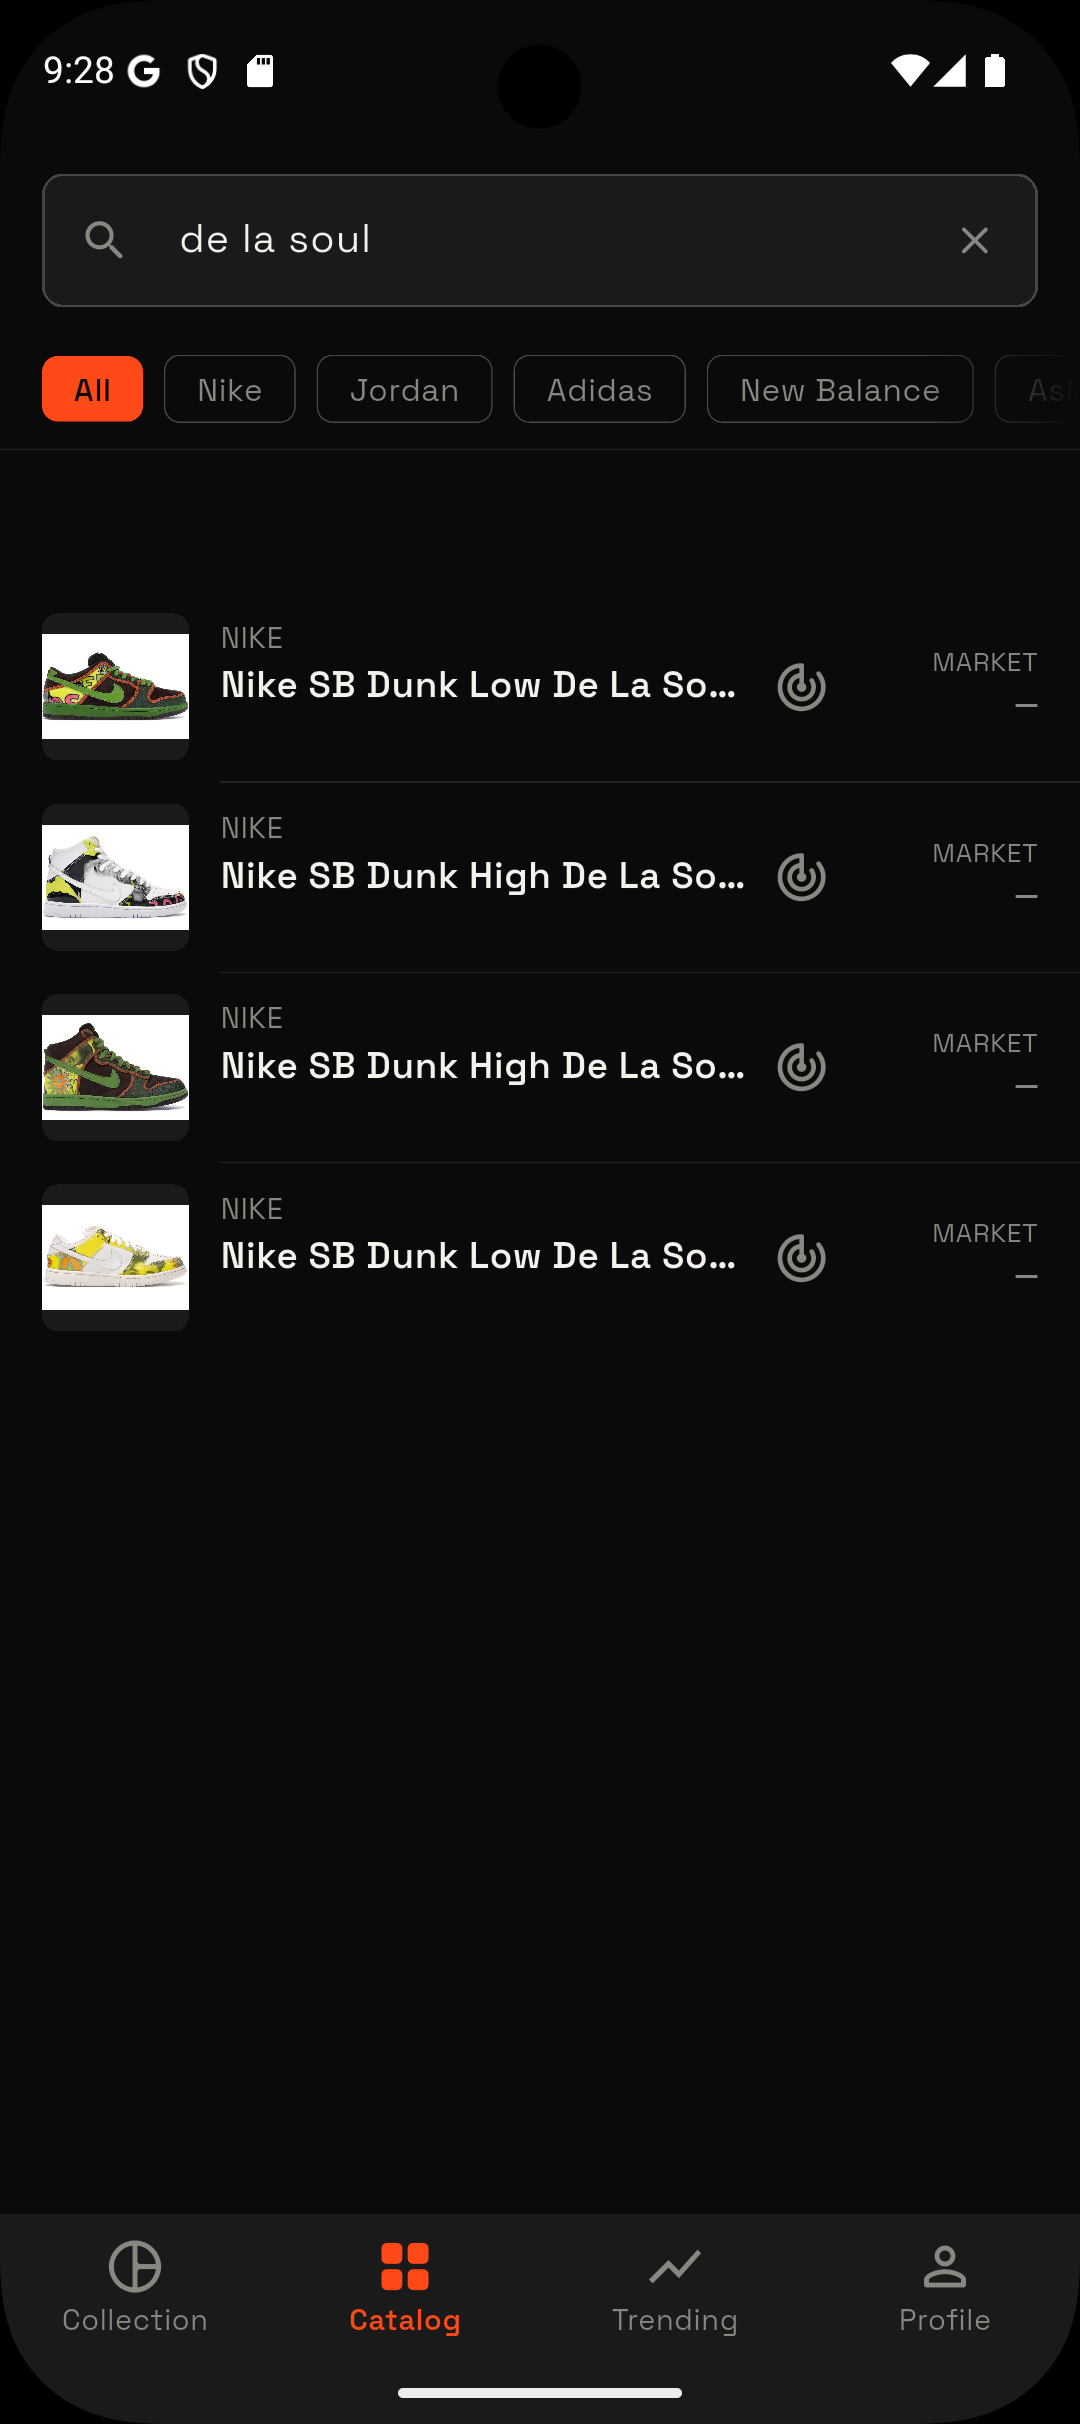
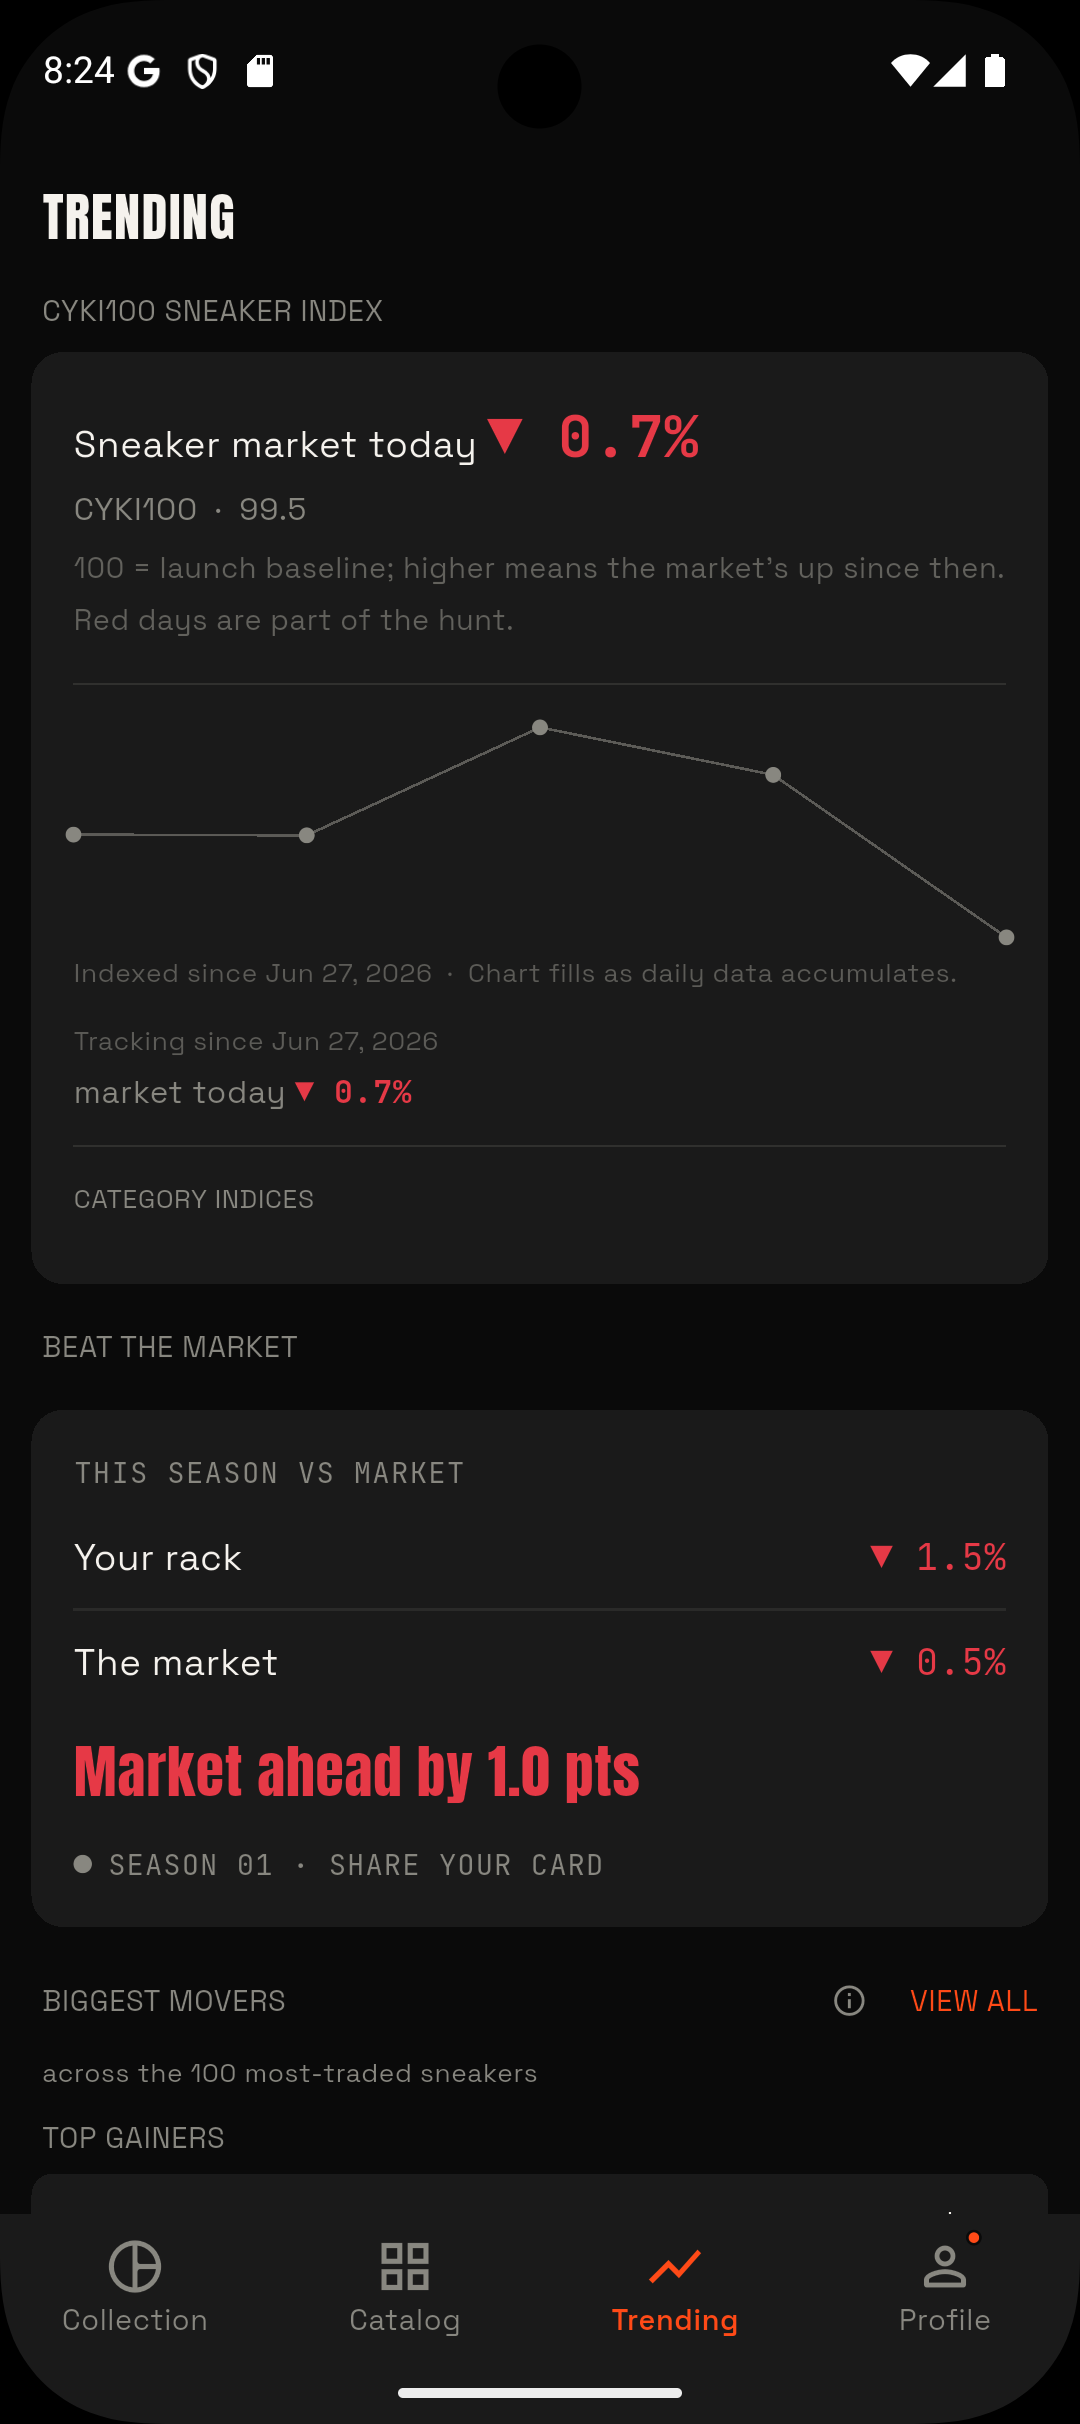
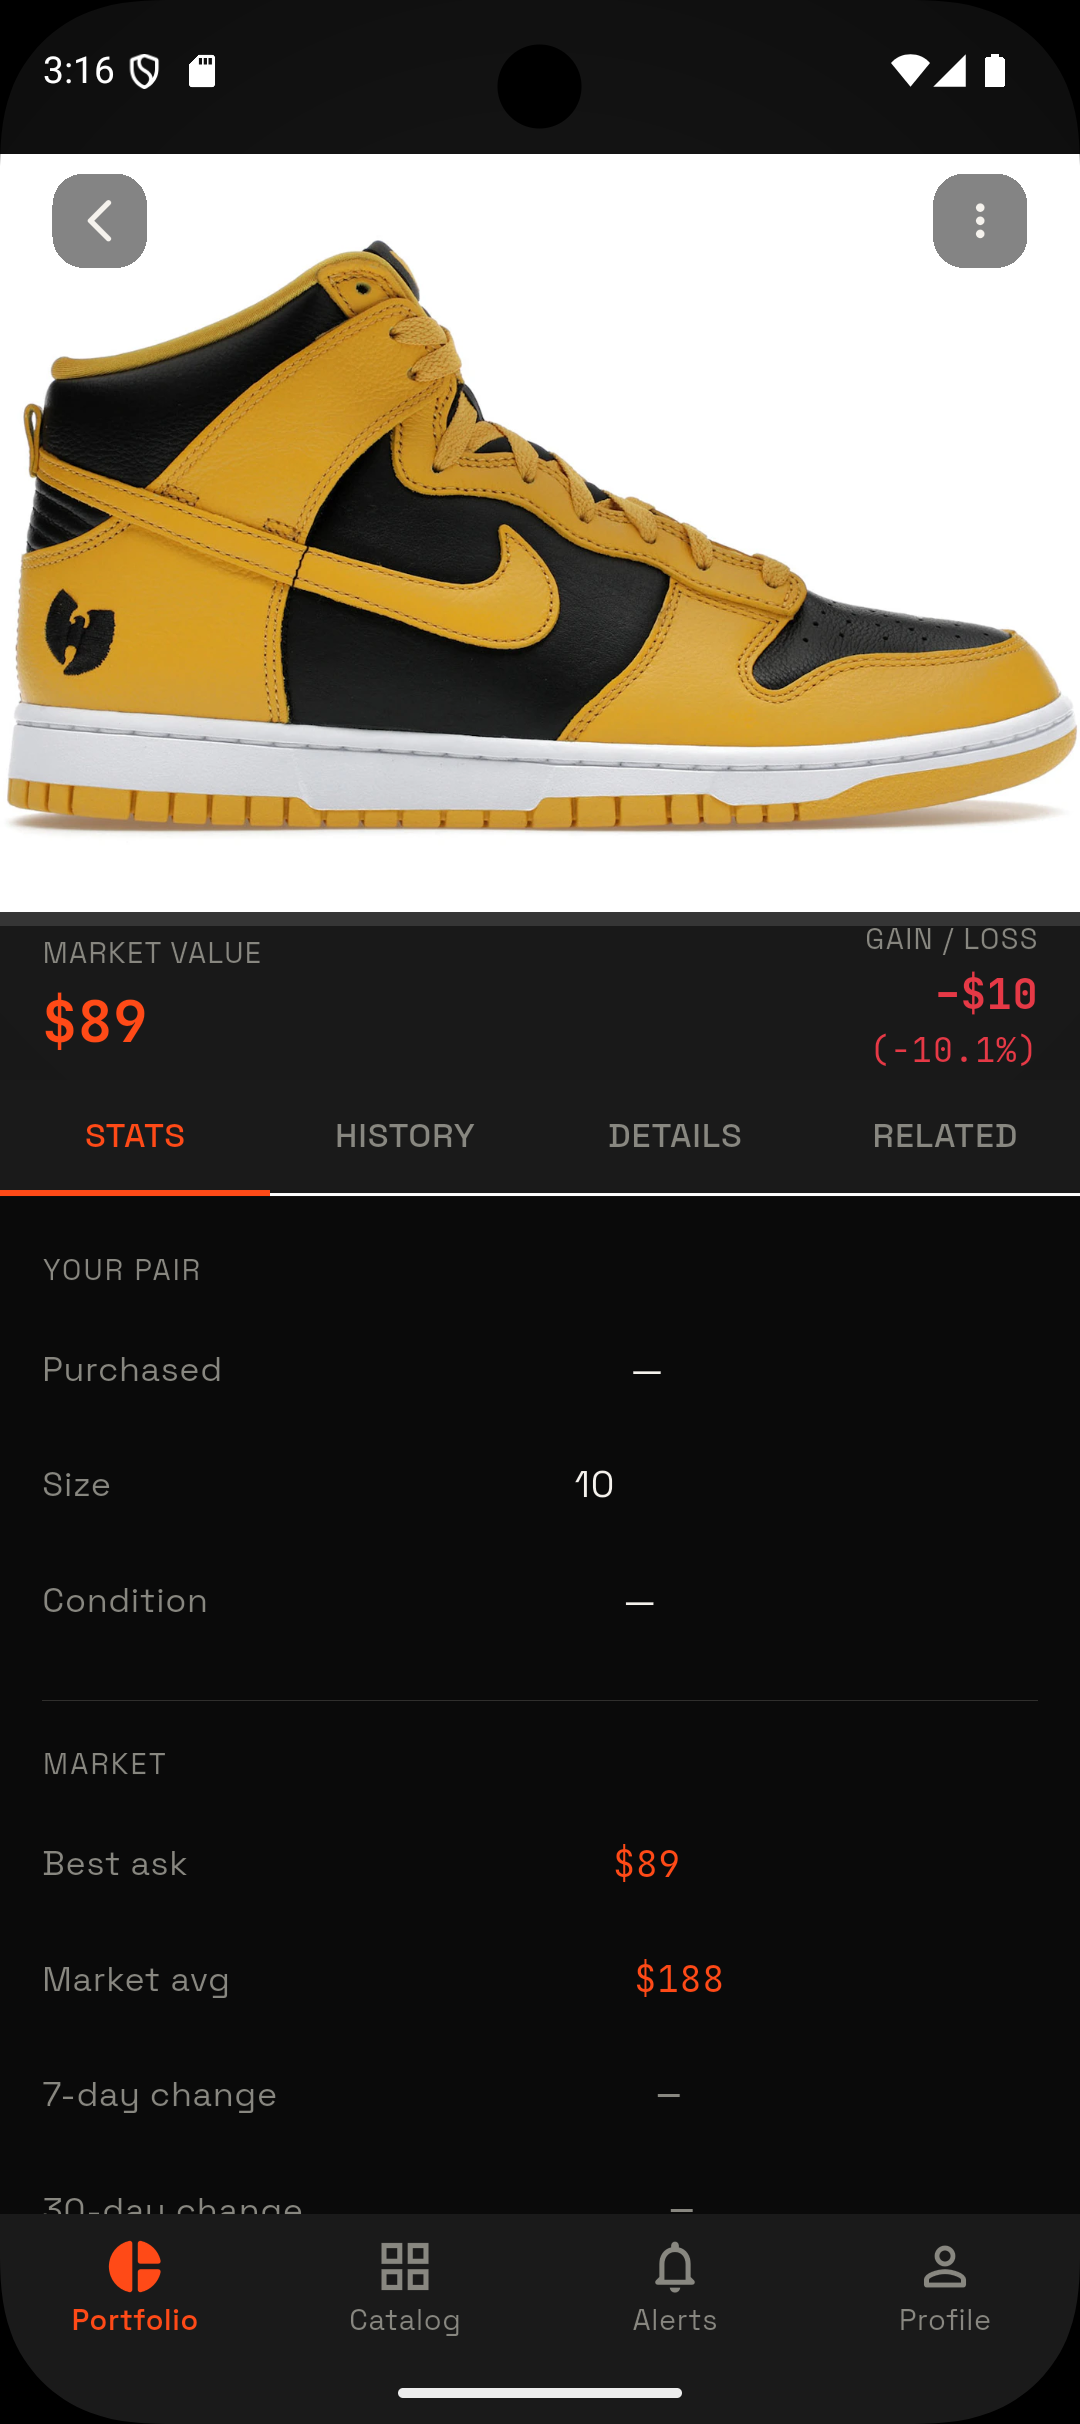
Every daily CYKI 100 reading from 27 June 2026 through 27 August 2026 — 62 rows, one per daily observation, computed each day at 02:00 UTC: observation date, index level, daily return, and the number of constituents that contributed a valid return that day. Plot it yourself, check our arithmetic, or chart it against anything else: cyki100-daily-levels.csv
The current level, the chart and the cohort table are published and updated at canyoukicksit.com/cyki100 — a stable URL to cite or link, so a story never has to quote a figure that has since moved.
Get the numbers every week
The CYKI 100 updates daily, so anything printed here is a snapshot. We send a short weekly drop — where the index closed, what moved most, and one chart cleared for you to post, watermarked and free to use with credit.
No cost, no exclusivity, no expectation of coverage in return. Reply to privacy@canyoukicksit.com with "weekly drop" and you're on it.
CYKI does not pay for placement and does not accept payment for it, in either direction, while the index is independent. If the number is for sale it isn't a benchmark, and a benchmark is the only thing we have worth handing you.
About CYKI
CYKI ("Can You Kicks It") is a free sneaker portfolio tracker: catalog every pair you own, see its live resale value, and track cost-basis profit and loss the way you would a stock portfolio. CYKI also publishes the CYKI 100, an independent daily index of the sneaker resale market built from aggregated marketplace data. Founded solo by Klaas Hermans, CYKI launched on Google Play and the App Store on 26 August 2026.
Contact
Klaas Hermans, Founder, Can You Kicks It, Denmark
privacy@canyoukicksit.com
www.canyoukicksit.com