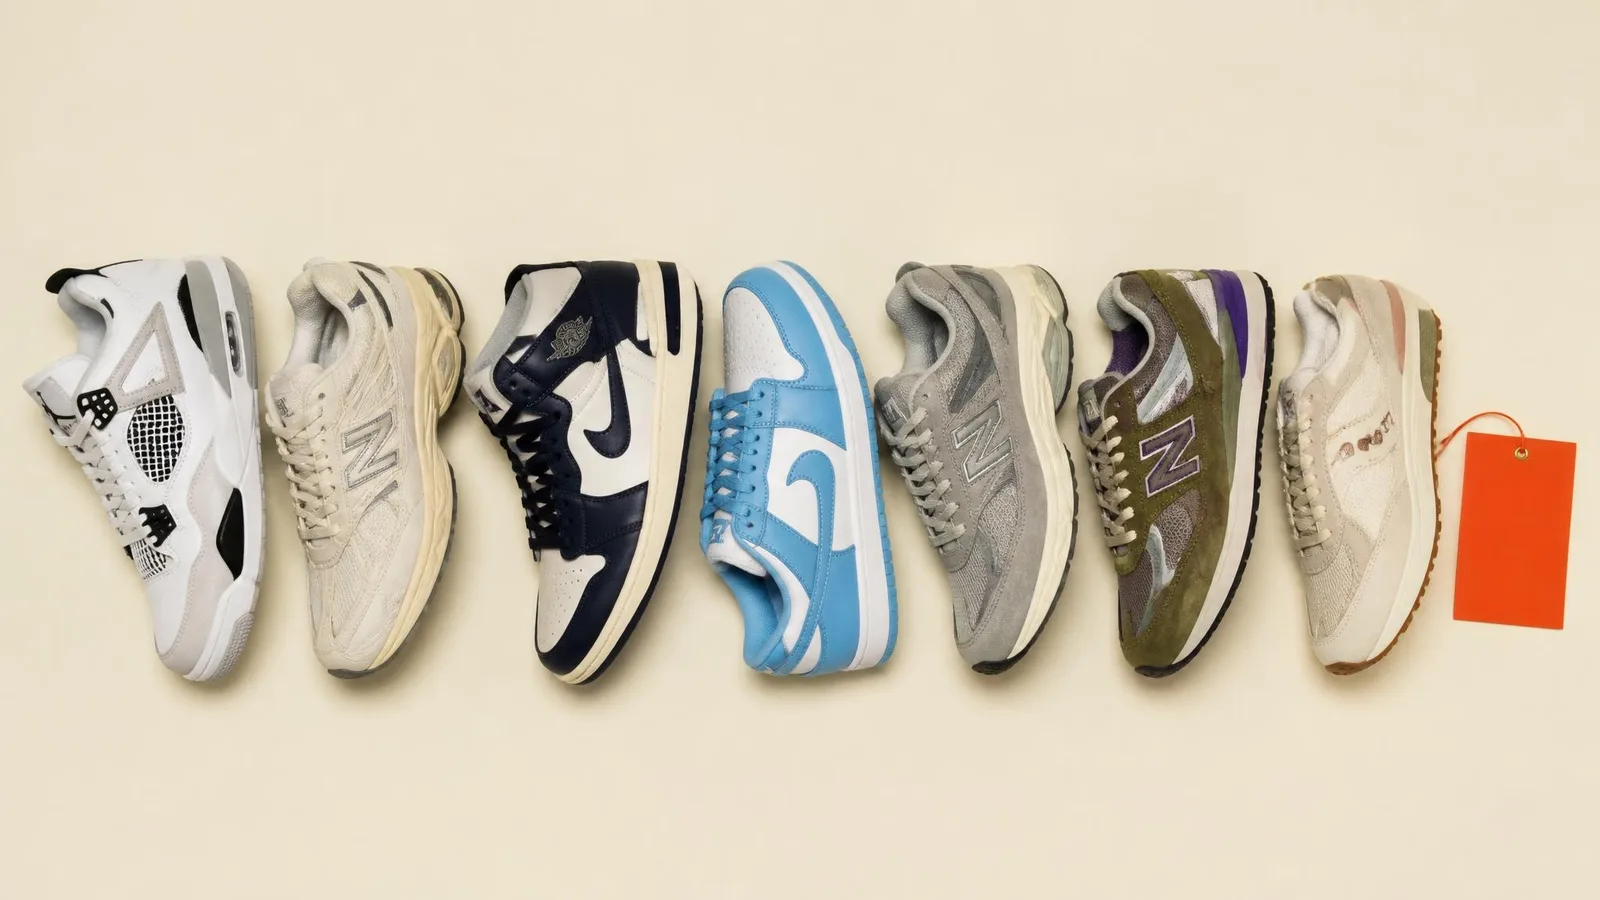
You already know what your pairs are worth individually. You check resale prices, you follow drops, you track what sold and for how much. But here is a different question: is the sneaker resale market up or down right now, as a whole?
A sneaker market index tracks the combined price performance of a defined basket of sneaker models from a fixed base level, using a consistent method applied repeatedly over time. It shows market direction and magnitude, not the value of every pair. The CYKI 100 is a resale-specific index built on real completed transaction data.
That distinction matters. A price chart for 1 model tells you about that model. A sneaker market index tells you what a defined group of models did together. It describes a specific basket, not every sneaker in the market and not every pair on your rack.
What a Market Index Actually Measures
An index is not a price. It is a measure of movement from a starting point. It tells you direction and magnitude: the market is up 6% from its base, or down 3% from last month. It does not hand you a dollar figure for any single pair.
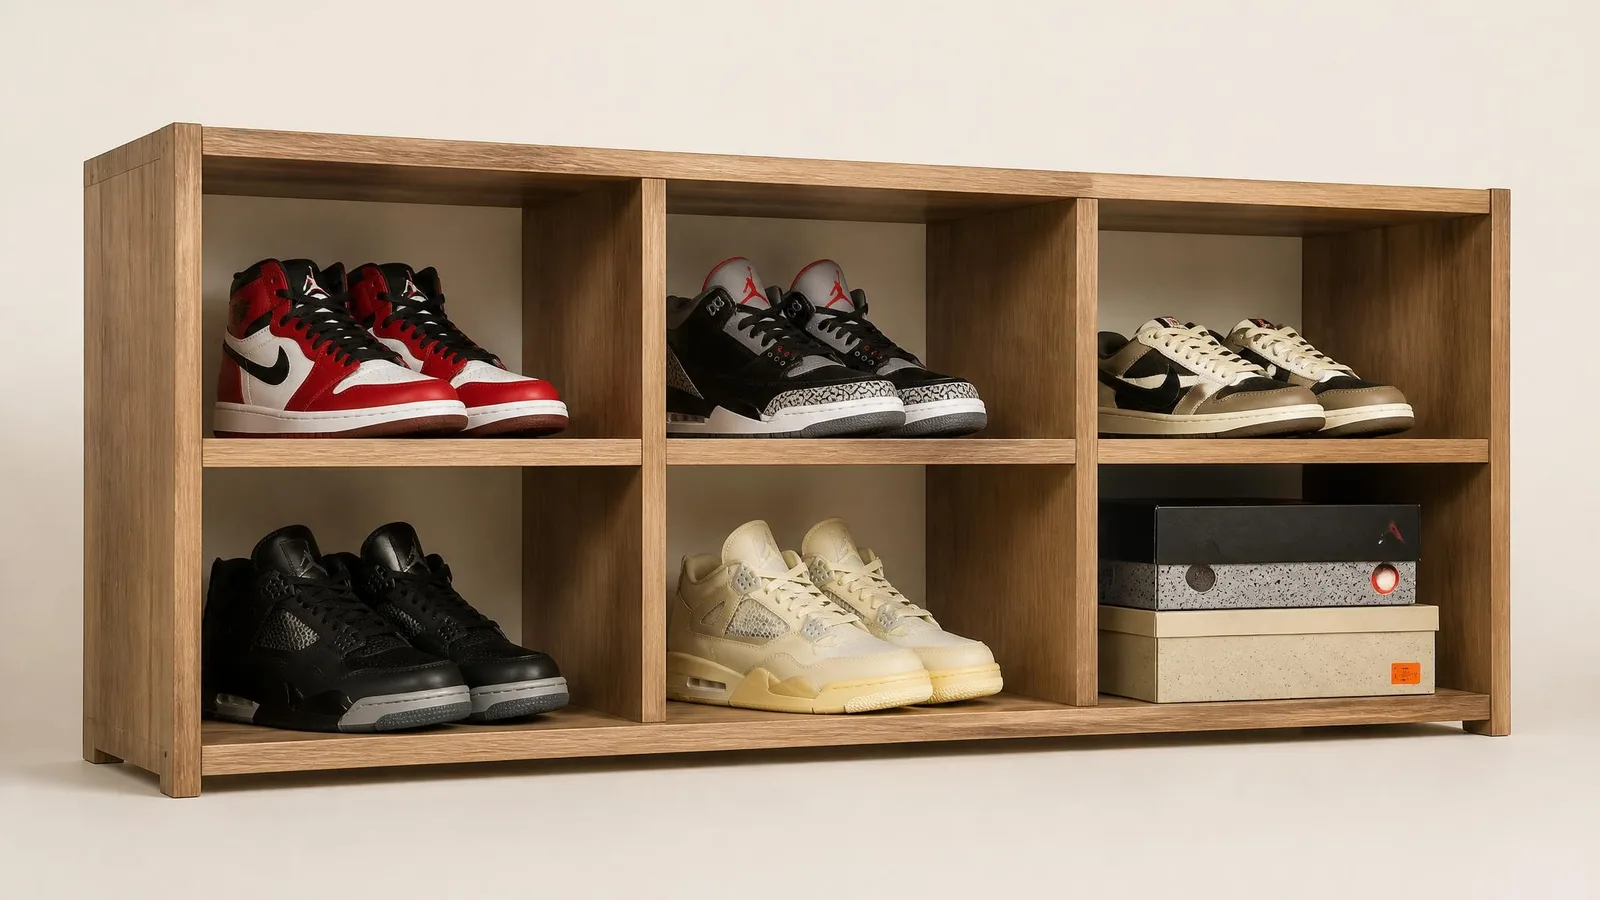
Think of it like a shared rack. Imagine a defined set of specific pairs sitting on a shelf that everyone agrees on. The same models, tracked the same way, from the same starting day. The index measures how the combined resale value of those pairs has moved since that fixed point.
For that measurement to mean anything, 4 things need to be in place: a defined basket of components, a fixed base level set at a specific point in time, repeated price measurement at consistent intervals, and a consistent calculation method applied every time. Remove any 1 of those, and you do not have an index. You have a guess.
This is why a single viral sale tells you nothing about the market. 1 pair selling for a record price shows demand for that model, in that size, in that condition, at that moment. It says nothing about whether Jordan 1s, Dunks, or Yeezys as a group moved up or down that week. A price chart for 1 model shows that model's history. An index shows the combined performance of a defined basket, which is a fundamentally different signal.
The index gives you context for what is happening beyond your own collection. You feel more informed about the money tied up in your pairs when you can measure their performance against a consistent reference point, not just a headline about 1 sale.
How the CYKI 100 Basket Is Built
The CYKI 100 is a resale-specific index. It is not a retail market forecast and not a hype ranking. It tracks a defined set of sneaker models based on real completed transaction data from resale marketplaces.
The basket is fixed and defined. It does not include every sneaker in the market or every pair on your rack. It is a specific group of models selected to represent the resale market, spanning categories like Jordan 1s, Dunks, Yeezys, New Balance, and collaborations. For the full basket composition, weighting, and how models are selected, see our methodology.
The index has a base level: a fixed starting point from which all movement is measured. A reading above the base means the basket is worth more in resale terms than it was at launch. A reading below it means the opposite. Every change is relative to that anchor.
Because the data comes from real sales rather than asking prices, it reflects what buyers actually paid. Asking prices reflect seller hope. Completed transactions reflect actual demand. That difference is what separates real market data from noise, and it is why collectors who care about how believable their valuations are should know where the numbers come from.
What a Single Viral Sale Cannot Tell You
When a pair sells for a record price, it tells you about demand for that specific model, in that condition, in that size, at that moment. It does not tell you what the rest of the market did.
The same week 1 pair goes viral, the broader basket of models tracked by the CYKI 100 could be flat, rising, or falling. You cannot know from a single transaction. A resale index built on a defined basket filters out the noise of individual outliers. What remains is the direction of the market, measured consistently.
This is also why asking prices on resale marketplaces are a weak signal — and why trading apps show different prices for the same pair. The price a seller lists reflects what they hope to receive. What a buyer actually paid is a different number. An index built on real sales data captures that difference.
Collectors often ask whether prices are accurate enough to be useful. The answer depends on what you are comparing. A screenshot of 1 sale gives you 1 data point. An index gives you a consistent reference point built on repeated measurement of a defined basket. The index does not eliminate uncertainty. But it gives you a benchmark that a viral headline cannot.
What the CYKI 100 Cannot Tell You
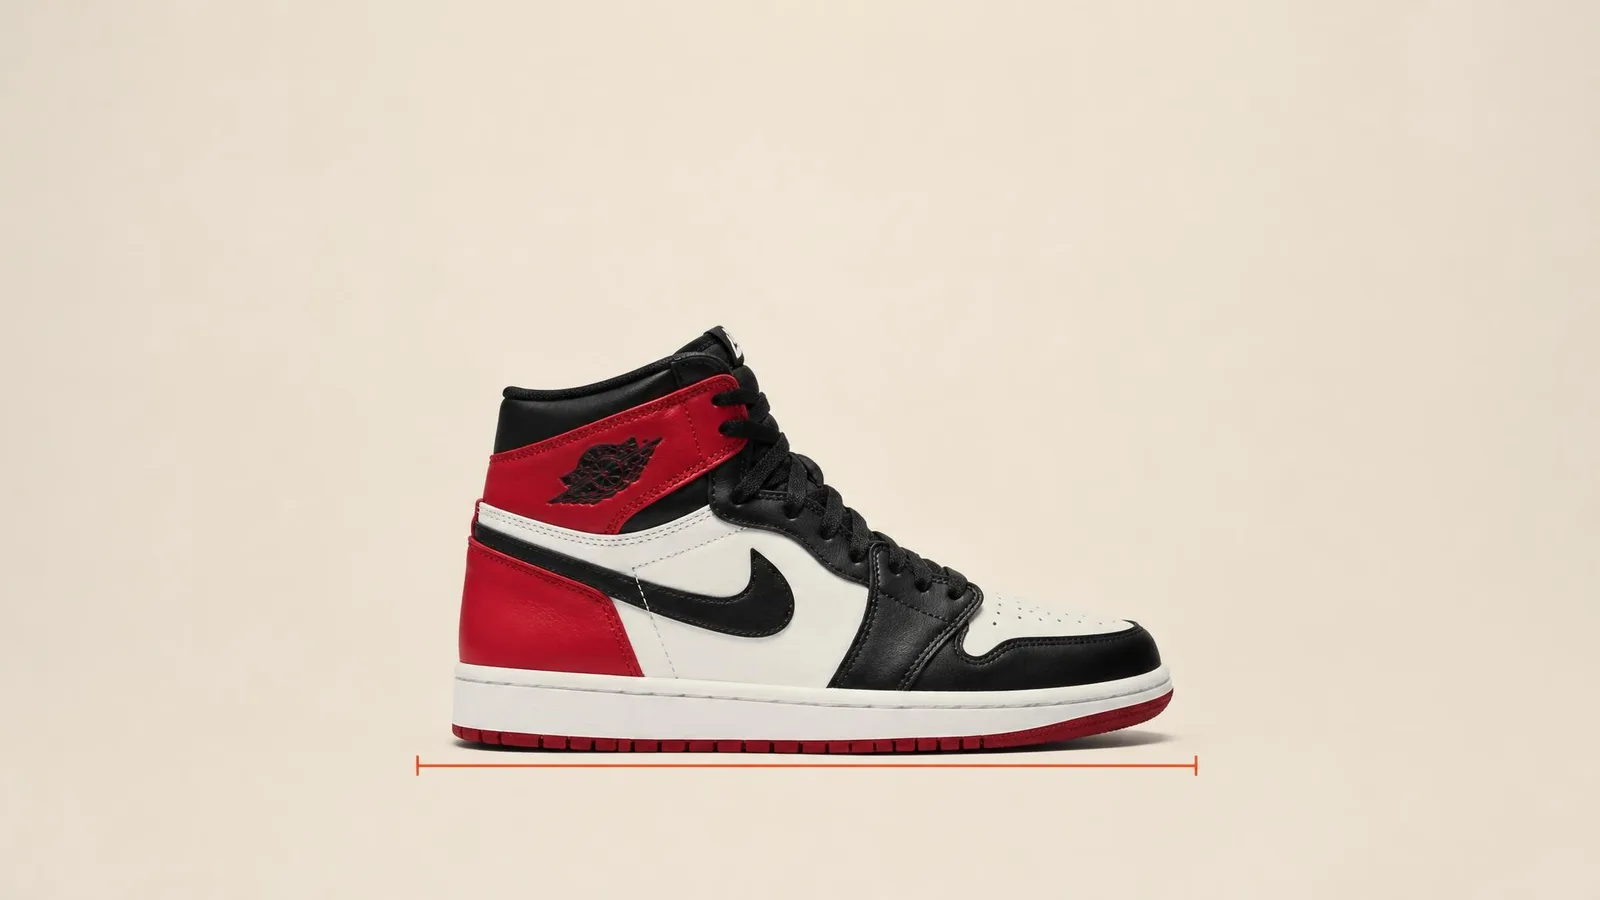
The CYKI 100 describes the performance of its defined basket only. Knowing what it does not cover is what makes the tool believable.
- Pairs outside the basket. If a pair you own is not in the CYKI 100 basket, the index level does not reflect what that pair is doing. The index measures a specific group of models, not the entire resale market.
- Condition differences. A worn pair and a dead stock pair of the same model are different assets. The index does not split them. Your pair's condition affects its resale value in ways the index cannot capture.
- Size premiums. A size 8 and a size 13 of the same model can trade at significantly different prices. The index works with representative price points, not size-specific data.
- Illiquid models. Models with very few recent completed sales may have price estimates based on broader reference methods rather than fresh transaction data. The methodology page explains how those gaps are handled.
- Your rack is not the index. A rising CYKI 100 does not mean your rack is up. Your rack value is an estimate based on resale marketplace data for the specific pairs you own, in your sizes, in their condition. Market direction and personal collection performance can move in different directions.
Stating these limitations is not a weakness. It is how you know exactly what you are looking at.
Using the Index to Benchmark Your Own Rack
Once you know what the index measures and where it stops, you can use it as a reference point for your own rack.
If your rack value estimate has risen while the CYKI 100 has fallen, your collection is outperforming the defined basket. If your rack value has dropped while the index is up, you are trailing it. Neither outcome is good or bad on its own. It is information.
This is the Beat the CYKI 100 idea: a collector's way of understanding whether the pairs you chose to hold are doing better or worse than the market benchmark. It is not a financial score. It is context.
The index turns an abstract market number into something personally relevant. Whether you are holding, wearing, buying, or selling, each of those decisions becomes more informed when you can measure against a consistent benchmark. Knowing your Jordan 1s went up is useful. Knowing they went up while the broader basket went down is a different kind of signal entirely.
Your rack value is an estimate based on resale marketplace data for your specific pairs — a sneaker resale value calculator can help you build that estimate for your collection. The CYKI 100 is the shared reference point that gives that estimate context. Understanding cost-basis tracking for individual pairs alongside the market benchmark closes the loop between what you paid, what your collection is worth now, and how it compares to the market.

Frequently Asked Questions
Can I use a sneaker index to track my collection? The index gives you a market benchmark, not a personal valuation. Your rack value is estimated from the specific pairs you own, in your sizes, in their condition. The index tells you what the defined basket of models is doing, so you can see whether your collection is moving with or against that benchmark.
What sneakers are included in the CYKI 100? The CYKI 100 tracks a defined basket of models selected to represent the resale market. For the full basket composition and weighting detail, see the methodology page.
How often is a sneaker market index updated? Update frequency matters because resale prices can shift quickly after a release, a colourway drop, or a cultural moment. The methodology page confirms the update frequency and data sourcing for the CYKI 100.
Is a sneaker index the same as a resale price chart for 1 model? No. A price chart shows 1 model's history. An index tracks a defined basket of models from a fixed base level, using a consistent method. That gives you a market-level signal that a single-model chart cannot provide.
What data does a sneaker index use? A credible sneaker resale price index uses real completed transaction data from resale marketplaces, not asking prices. The CYKI 100 is built on real sale data and explains openly how it handles gaps where thin sales data affects transaction volume.
Conclusion
A sneaker market index is a defined basket, a base level, and a consistent method applied over time. It tells you market direction, not the value of every pair. The CYKI 100 is built on real completed transaction data, describes a specific basket, and states its limitations so you know exactly what you are looking at.