
If you own enough pairs that your total rack value feels like a guess, a rising number on screen can look like progress. But a gain in pounds or dollars does not tell you whether your sneaker collection value vs market benchmark is strong or weak. It only tells you the number went up.
Comparing your sneaker collection to the market means measuring the percentage your rack value changed against the percentage the CYKI 100 changed over the same window, starting from the same date. That separation is what strips out market-wide movement and isolates the performance specific to your pairs.
The rest of this piece breaks down how that comparison works, walks through a hypothetical example, and explains what the result actually tells you.
Why a Dollar Gain Does Not Tell You Enough
Your rack value climbed £500 over the past year. That feels like a win. But if the broader sneaker resale market rose 20% during the same window, and your rack only rose 10%, your collection actually trailed the market by 10 percentage points. The pound figure hid a gap.
Market movement and your rack's movement are two separate things. When the whole market lifts, every rack benefits. The question is whether yours lifted more or less than the tide.
Sneaker resale prices carry real volatility, too. A single pair's 12-month trading value could shift by an average of $1,576, a figure Self Financial's sneaker collectibles research documented across the pairs it studied. That kind of swing makes raw dollar figures especially unreliable as a performance signal. Your rack might look healthy in pounds while a chunk of that movement is just market-wide noise.
The collector who sees a big number and assumes strong sneaker collection performance may be the same collector who underperformed the market without knowing it.

How Like-for-Like Percentage Comparison Works
A fair way to compare your sneaker collection to the market starts with fixing a single date. Both your rack and the CYKI 100 get measured from that same baseline. Without a shared start date, you are comparing two different journeys.
The calculation is simple. Take your rack value at the start date. Take your rack value now. Express the difference as a percentage. Do the same for the CYKI 100 over the same window. Then compare the two percentages. Once you have both numbers, you can see whether your rack beat the CYKI 100 or trailed it.
The start date matters because entering at different points produces different baselines. A collection built over several years needs a defined window, not a lifetime average, to produce a meaningful like-for-like sneaker collection comparison from a shared start date.
Percentage comparison also strips out collection size. A 15% gain on a 10-pair rack and a 15% gain on a 60-pair rack represent the same relative performance. The pound figures would look very different, but the signal is identical.
What the CYKI 100 Measures
The CYKI 100 tracks the resale market movement of a defined set of sneakers. It gives collectors a single reference line to measure their own rack against. The data is powered by real resale activity, updated regularly, so the benchmark reflects actual secondary market transactions rather than asking prices or retail figures.
Like any benchmark, the CYKI 100 represents the market broadly. Your rack is a concentrated selection of specific pairs. It will almost always diverge from the index in some direction, and that divergence is the whole point of the CYKI 100 comparison.
Transparency matters here. Rack value is an estimate based on resale marketplace data, not a guaranteed sale price. The CYKI 100 carries the same caveat. Both figures are the best available signal, not a contract. When recent sales for a pair or size are scarce, the confidence behind that signal narrows. What thin sales data means for your estimate explains how fallback values and data depth affect the number you see. CYKI surfaces the gaps in its data rather than hiding them; you can read more about how the estimates are built on CYKI's methodology page.
A Simple Worked Example
Say your rack was estimated at £2,000 at the start of a 12-month window and is now estimated at £2,300. The CYKI 100 started at 1,000 and now sits at 1,080. Here is the sneaker collection percentage gain calculation laid out step by step.
| Step | Your Rack | CYKI 100 |
|---|---|---|
| Start value | £2,000 | 1,000 |
| End value | £2,300 | 1,080 |
| Change | +£300 | +80 |
| Percentage change | +15% | +8% |
| Gap | +7 percentage points above the CYKI 100 |
In this hypothetical, your rack outperformed the sneaker resale benchmark by 7 percentage points. The £300 gain is real, but the percentage gap is the meaningful signal.
The same logic works in the other direction. If the CYKI 100 rose 15% and your rack rose 8%, you trailed the market by 7 percentage points. Your rack still gained value in absolute terms. It just gained less than the broader market did over the same window.
Every figure in this example is hypothetical. Your own numbers will depend on what you own, when you set your start date, and how the market moved during that window.

What Outperformance Does and Does Not Mean
If your rack outperformed the CYKI 100 over a given window, that is genuinely interesting context. It tells you that your specific selection of pairs moved more than the broader market did during that period. Knowing whether you beat the sneaker market is a useful reference point.
It does not tell you that you are a skilled buyer. A concentrated collection in a handful of pairs that happened to spike is not the same as a repeatable strategy. What happened over the last 12 months is a historical fact, not a forecast of the next 12.
Outperformance and underperformance are both normal. A rack of 15 pairs is far more concentrated than a 100-pair index, so divergence in either direction is expected. Your rack will rarely track the CYKI 100 closely, and that is fine.
Use this context to inform decisions about holding, wearing, buying or selling. Treat it as one signal among many, not a verdict on your collection or your instincts. Some pairs carry personal weight. Some carry financial weight. Most carry both, and the number on screen is only one part of the story.
How to Compare Your Rack with the CYKI 100
The comparison starts with racking your pairs. Whether you add pairs manually or use a migration feature later, each pair you add brings your rack value closer to a complete picture.
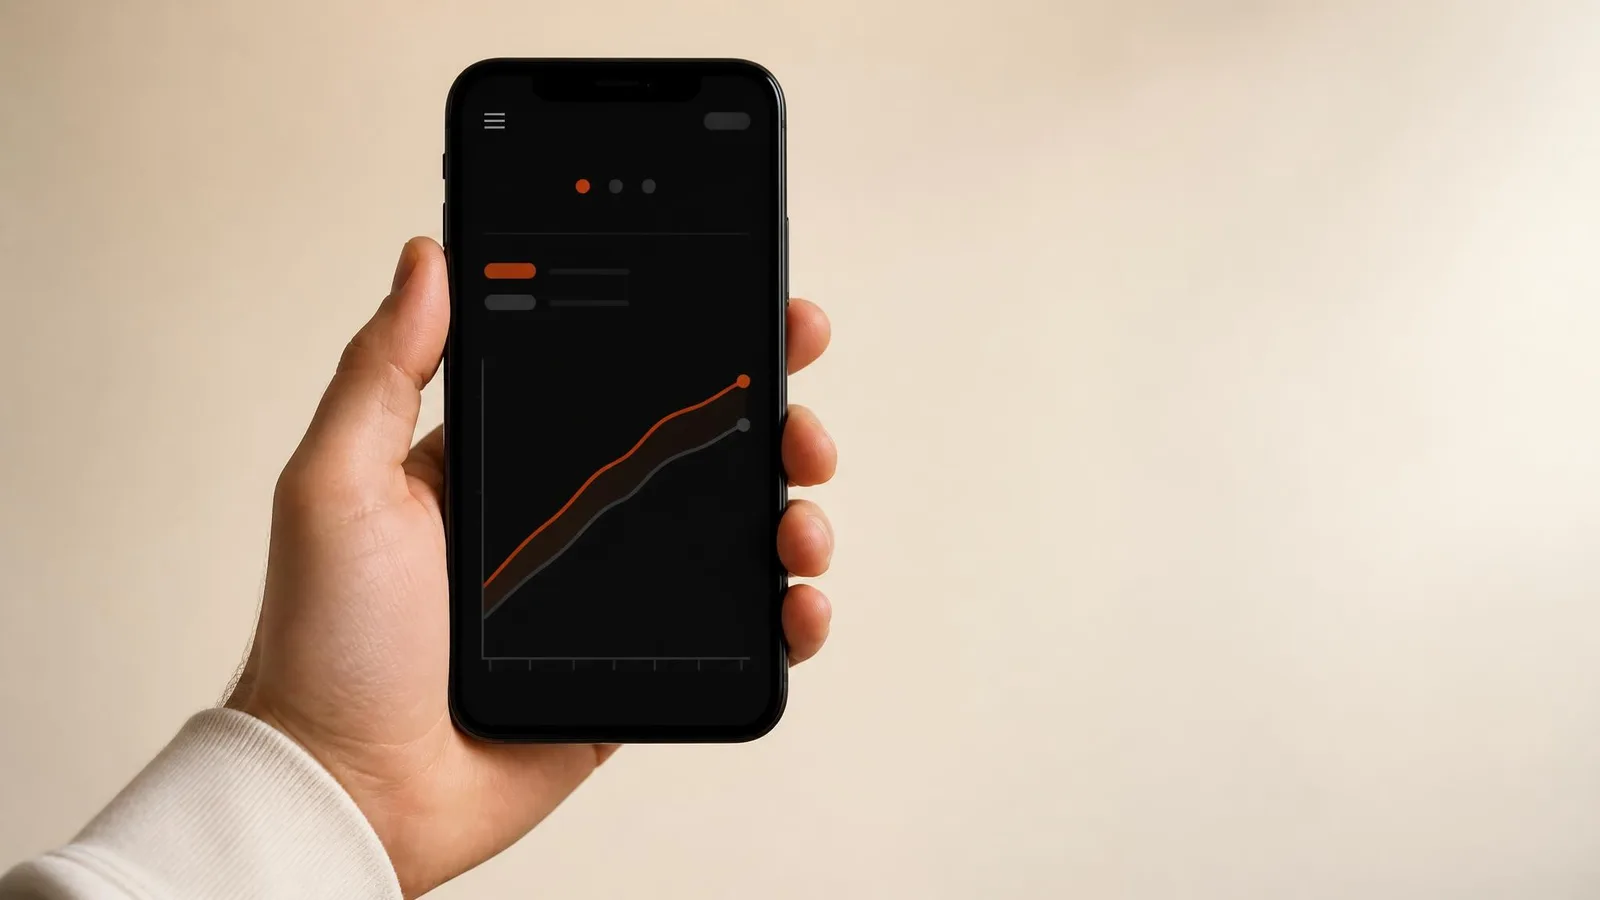
Once your rack is set up, CYKI surfaces the comparison against the CYKI 100 from a shared start date. You see both lines side by side. The more complete your rack, the more meaningful the comparison. A rack with 5 of your 30 pairs is not a fair representation of how your collection moved.
Rack your pairs and compare their movement with the CYKI 100. Beat the CYKI 100.
Frequently Asked Questions
Is my sneaker collection outperforming the market? You can only know by comparing the percentage change in your rack value to the percentage change in the CYKI 100 over the same window from a shared start date. A higher rack value in pounds or dollars alone does not confirm outperformance.
What is the difference between rack value and resale market performance? Rack value is an estimate of what your collection could fetch on the resale market right now, based on recent resale marketplace data. Market performance is how that estimated value has moved over time relative to a benchmark like the CYKI 100.
Does outperforming the CYKI 100 mean I made good buying decisions? Not necessarily. Outperformance is historical context. It tells you your pairs moved more than the broader market during a specific window. It does not confirm skill or predict how your rack will move next.
Why do my collection gains look big in pounds but feel smaller than expected? If the market rose sharply during the same period, your pound gain may look large in absolute terms but fall short in percentage terms compared to the broader market. That gap is exactly what the CYKI 100 comparison reveals.
Conclusion
A rising rack value, estimated from resale marketplace data, is a good sign. But percentage movement from a shared start date is the only comparison that tells you whether your collection ran with the market, ahead of it, or behind it. Outperformance is context, not a verdict. Use it to understand your rack, not to draw conclusions about skill or future results.
Rack your pairs and compare their movement with the CYKI 100.